Using the ‘plutil’ utility to fix improperly-formatted Xcode plist files

How do you find typos (syntax errors) in an improperly formatted plist (property list) file, especially when Xcode provides absolutely no detail about badly formed XML? I often see plist files with a thousand or more lines of text! In this article, I’ll show you how to fix plist bugs — and do a few other things — by using the little-known plutil command line tool.

How many times have you seen the following error message, shown below in textual and graphical format, when doing a build?

Info.plist build error

Jump straight to the fix or take a minute to read a little background.

Continue reading “Using the ‘plutil’ utility to fix improperly-formatted Xcode plist files”

Controlling chaos: Error checking in Swift 4 with if let, guard, and failable initializers

Swift tutorials by iosbrain.com In this tutorial, the third in a series of tutorials, we’re going to finish the arduous topic of looking for unexpected values, events, and conditions that arise during program execution, using a technique I like to call “error checking.” Today, I’ll concentrate on nil values, optionals, optional binding, the guard statement, failable initializers, and finally, give you some advice about keeping your error checking code consistent, for example, when to use Swift “Error Handling” or when just to return true/false or use guard statements.
Continue reading “Controlling chaos: Error checking in Swift 4 with if let, guard, and failable initializers”

Finding memory leaks with the Xcode Memory Graph Debugger and fixing leaks with unowned and weak

In this tutorial, I’ll show you how to track down memory leaks within Xcode via the Memory Graph Debugger, new since Xcode 8. This is a powerful visual tool and doesn’t require you to step out of Xcode and start the Leaks Instrument. Once we identify some memory leaks, I’ll show you how to plug those leaks by using the Swift language’s weak and unowned qualifiers, and talk about the differences between the two qualifiers.

I recently discussed iOS memory management and memory leaks that occur when using reference semantics and reference types (classes) in my tutorials on “Swift 4 memory management via ARC for reference types (classes)” and “Fixing memory leaks — strong reference cycles — in Swift 4.” After reading these articles, you should understand how easy it is to inadvertently encode and introduce a strong reference cycle into your Swift 4 code and thus end up with a memory leak. You should also understand how generally straightforward it is to fix such a memory leak. My sample code in both tutorials was didactic. What about real-world projects with hundreds of thousands or millions of lines of code? Suppose that you’ve heard reports of diminished app performance, low memory warnings, or just plain app crashes. Finding memory leaks in your code is quite cumbersome when trying to debug via rote inspection, setting breakpoints, adding logging statements, etc.

Continue reading “Finding memory leaks with the Xcode Memory Graph Debugger and fixing leaks with unowned and weak”

Fixing memory leaks — strong reference cycles — in Swift 4

PREREQUISITES FOR THIS TUTORIAL

If you don’t understand how Swift manages memory for classes (reference types), you need to read the first article in this series, “Swift 4 memory management via ARC for reference types (classes)”. Once you understand how reference type-based memory is managed with ARC, you’ll be ready to understand how to prevent memory leaks from occurring in your app. Remember that ARC only applies to reference (class) types, not value types like struct and enum instances.

THE ARC DEALLOCATION PROCESS

Remember how we visualized the reference count that ARC maintains on the allocated instance of reference type Widget in my introductory ARC tutorial?

Continue reading “Fixing memory leaks — strong reference cycles — in Swift 4”

Controlling chaos: Error Handling in Swift 4 with do, try, catch, defer, throw, throws, Error, and NSError

[Download the Xcode 9 playground from GitHub so you can follow along with my detailed discussion and try iOS error handling using the do-try-catch feature yourself!]

This tutorial is the second in my series of tutorials on incorporating error checking into your Swift 4-based iOS apps. Remember that by “error checking,” I mean gracefully handling unexpected values, events, and conditions that arise during program execution.” Today, I’ll limit my discussion of error checking to what Swift’s authors call “Error Handling.” Please read my first, introductory article in this series if you haven’t already. I can’t emphasize enough why you need to use error checking. Remember my discussion of app quality, user intolerance of buggy apps, and the huge amount of choices consumers have? The quality of your apps represents your reputation. Do you want a bad reputation when customers choose apps largely based on reviews? They can and will vote with their fingers (and wallets) and find other apps if they don’t like your app(s). Download my Xcode 9 playground so you can follow along with my discussion, run the code, and experiment with my Swift code by making your own changes.

Continue reading “Controlling chaos: Error Handling in Swift 4 with do, try, catch, defer, throw, throws, Error, and NSError”

Xcode: using the “Debug executable” checkbox to step through app release versions

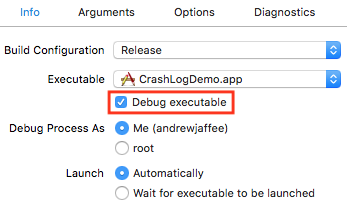
Here’s an Xcode setting, but what does it do for developers?

There’s a checkbox named “Debug executable” on the “Info” pane for Xcode’s “Debugging Options in the Scheme Editor.” Why is there such a dearth of information on this checkbox, a “simple” Xcode scheme option? Apple has little to say about the feature. Information about it is scarce on the web. I’ve heard all sorts of different opinions about what the checkbox does or doesn’t do. (Some of this may be exacerbated by Apple releasing buggy versions of Xcode.)

I’ll discover and explain, using the scientific method, how the “Debug executable” checkbox works. You may be thinking this is much ado about one checkbox, but my purpose is to get you to think about and learn a lot about debugging with Xcode. The absolute best developers are the ones with great and instinctive debugging, nay, TROUBLESHOOTING, skills.

Continue reading “Xcode: using the “Debug executable” checkbox to step through app release versions”

Debugging: symbolicating crash reports manually (stack trace, backtrace)

Swift tutorials by iosbrain.comToday, we’ll talk about manually symbolicating iOS and OS X application “crash reports.” Why? When you hear about a crash in one of your apps from a customer, the first thing you should do is try to get a copy of the crash report. But there are times when you get crash reports that aren’t automatically symbolicated, or that you can’t symbolicate by dragging into Xcode, or are partially symbolicated. When not symbolicated, you’re reading numeric addresses when you want to be reading code, like your function/class names. There are workarounds and we’ll discuss one today. Download the sample Xcode 9 project written in Objective-C to follow along. What’s a crash report, anyway? According to Apple:

Continue reading “Debugging: symbolicating crash reports manually (stack trace, backtrace)”